Free PDF Tools Online
WPS Office®
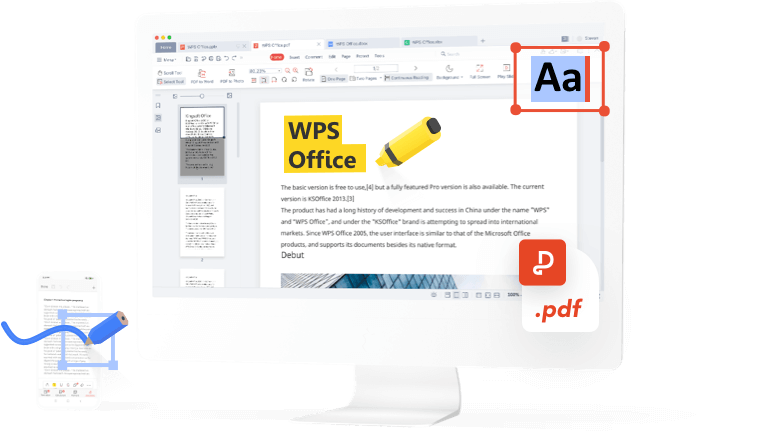
Best online PDF editor, converter, merger, form filler and organizer for easy editing page, text or layout on pdf documents like Word for FREE in seconds.
Download WPS Office and Edit PDF
Download WPS Office to get more PDF management features such as OCR (image scanning and conversion), adding watermarks and e-signatures, and PDF to image conversion.

Free Download for PC

WPS Office for Windows
Download WPS Office Desktop Editor to get a lightweight PDF tool that provides complete solutions for all PDF problems.
Free Download
4.8MB / Jul 4 2022

WPS Office for Mac
WPS Office, perfectly compatible with the macOS system on Mac, and supports Intel and Apple chips to help you edit PDFs easily.
Free Download
553KB / Feb 6 2023

WPS Office for Linux
WPS Office is a free office suite that supports Linux. Download the WPS Office app to access PDF tools anytime.
Free Download


Free Download for Mobile

WPS Office for Android
Google Play Best of 2015


WPS Office for iOS
App Store Best of 2015


About WPS PDF
WPS PDF is a useful all-in-one PDF online tool. It is easy to edit, convert and manage PDF files, you can try it for free. For efficient PDF processing, please use WPS PDF.
WPS PDF is also compatible with a variety of file formats, including Adobe PDF. PDF is now a component of WPS Office application, providing collaborative viewing, annotation, and editing.
WPS PDF is also compatible with a variety of file formats, including Adobe PDF. PDF is now a component of WPS Office application, providing collaborative viewing, annotation, and editing.

PDF Guide - How to Instructions
WPS PDF Blog
PDF Blog helps you fully understand how to use PDF tools, provides you
quick access to software news, recommends different types of office
software worth downloading, and offers you information about PDF version
update.
More Articles >
 Downloads
WPS PDF VS Small PDF : PDF Editor Comparison
WPS PDF VS. Small PDF : PDF Editor Comparison The standard format for sharing and distributing documents over many platforms is PDF. It saves a lot of natural resources, it protects the files from being misused, and you can lock viewing or editing of the documents behind a password. Many tools have emerged over time that are available to edit, annotate, and convert PDF files. One of the PDF editors which are discussed a lot is WPS PDF. It is a versatile editing tool with an incredibly .... Software News
WPS PDF VS PDF 24 | Which one is Better?
PDF 24 and WPS PDF are well-known PDF editor apps. Comparing WPS PDF vs PDF 24 will be unfair as there is no competition between WPS PDF app and PDF 24. PDF 24 is only for windows OS. On the other hand, WPS PDF is available for all operating systems including Linux and iOS. However, this blog will compare both by their features. About PDF24 PDF24 is a free PDF Creator and PDF Converter app for Windows devices only, accomplished with a number of useful features that you will love to wor.... Software News
WPS PDF VS Soda pdf | Which PDF Editor is Better?
WPS PDF VS Soda PDF What is Soda PDF? Soda PDF is features-enriched app that provides you with the free services to create PDFs from any popular file format, edit existing PDFs and to convert PDF to other formats like Word, Excel, PPT, image, HTML and vice versa. With Soda PDF you can merge multiple files into a single PDF, or to split a PDF document into several other files, such as smaller-sized PDF files and images files. All these services are also available on Soda online platform....
